Run Report — Detailed AI Brand Evaluation Results Analysis
How to read a BrandWise run report: Overview, Dialogs, and Competitors tabs. Hero cards, model heatmap, intent table, dialog transcripts, and competitor matrix.
What Is a Run Report
Each scenario run generates a dedicated report with evaluation results. A run report is a detailed data snapshot from a single execution: all model responses, metric scores, dialog transcripts, and competitive analysis.
To open a report, navigate to your project's Reports section, find the desired run in the list, and click it. The report page contains three tabs:
| Tab | Purpose |
|---|---|
| Overview | Aggregated KPIs, model and intent tables, automated insights |
| Dialogs | All model responses with scores, filters, transcripts, and analysis |
| Competitors | Competitor position matrix across models |
Overview Tab
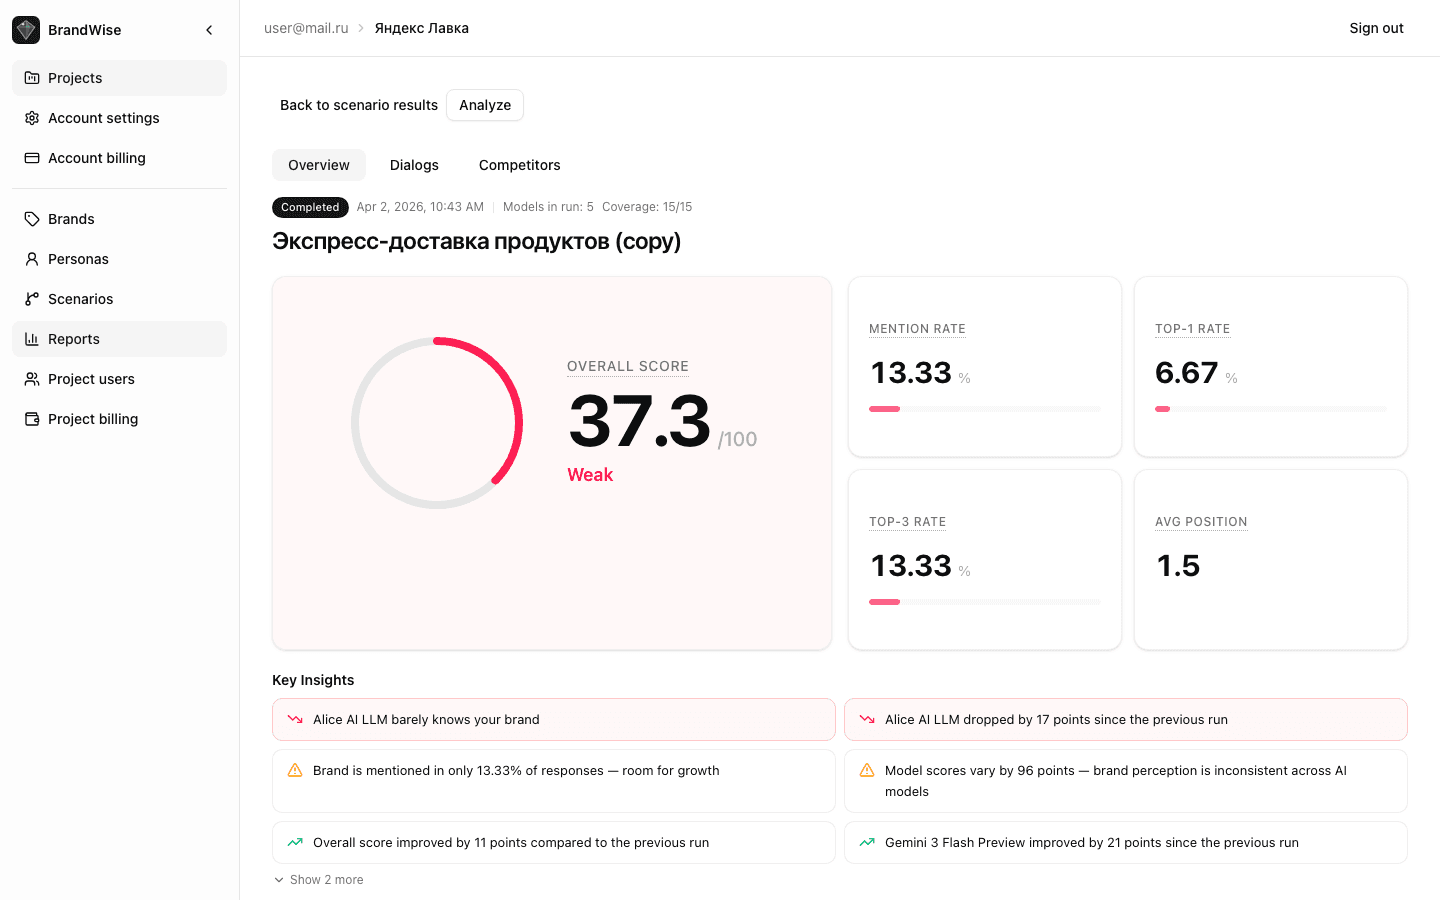
Hero Card with Overall Score
At the top — a ring indicator showing the aggregate visibility score (Overall Score, 0–100). Ring color reflects the value:
- 70–100 (green) — excellent brand visibility
- 40–69 (yellow) — average level with room for improvement
- 0–39 (red) — weak visibility requiring attention
Run KPI Cards
Four cards with key metrics for this specific run:
| Metric | What It Measures |
|---|---|
| Mention Rate | Share of responses mentioning the brand |
| Top-1 Rate | Share of responses where the brand is recommended first |
| Top-3 Rate | Share of responses where the brand ranks in the top three |
| Avg Position | Average brand position among recommended options |
Each card includes a progress bar for visual assessment.
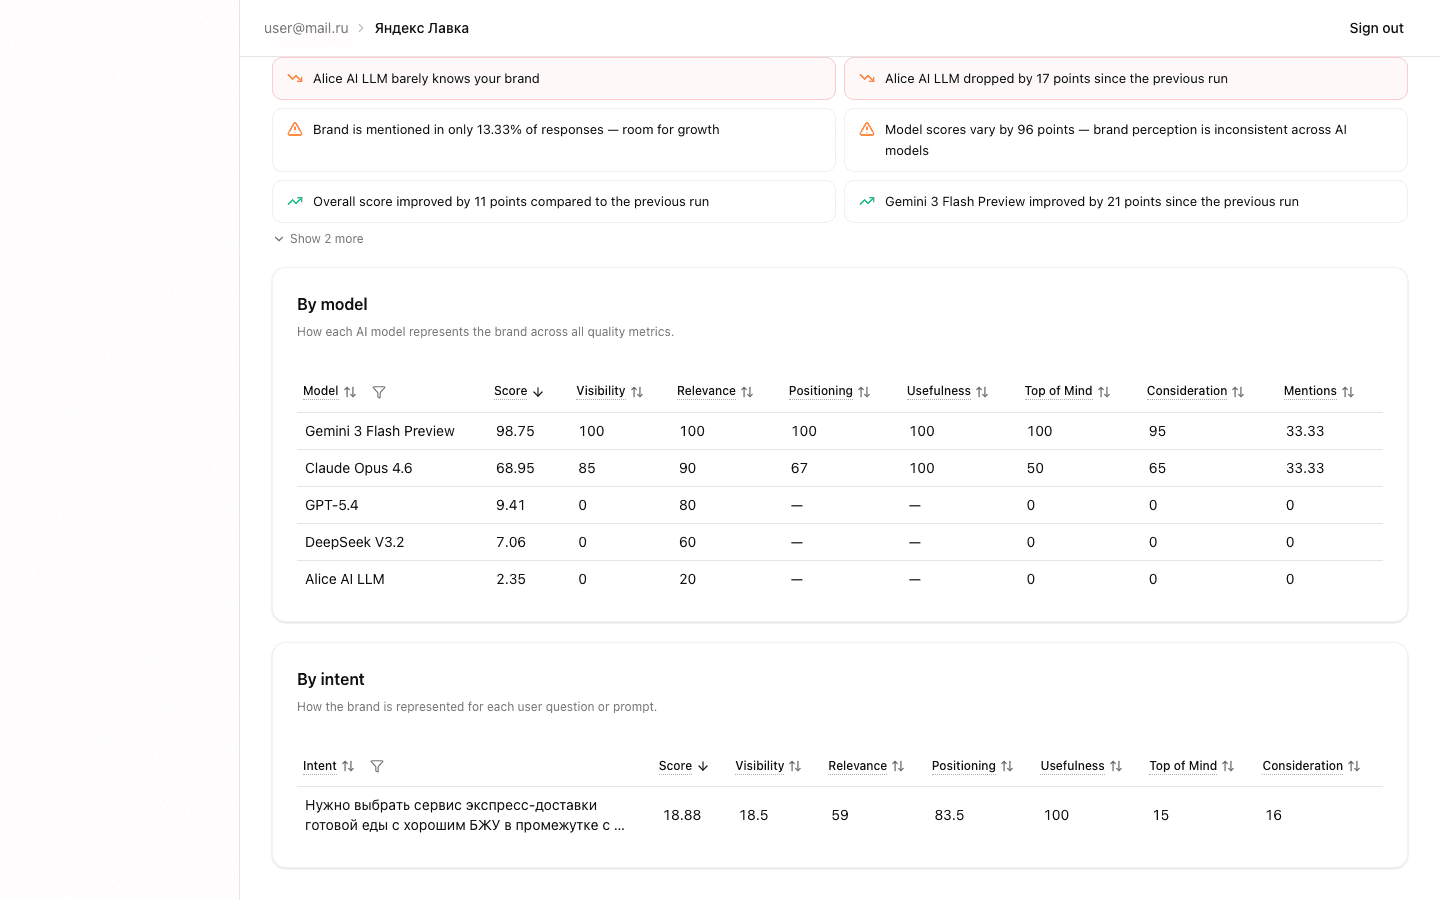
By Model Table — Metric Heatmap
This table shows results for each AI model included in the scenario. Columns:
- Model — name (GPT-4o, Claude, Gemini, etc.)
- Overall Score — aggregate score 0–100
- Visibility — median visibility value
- Relevance — median relevance value
- Positioning Match — positioning alignment
- Usefulness — recommendation usefulness
- Top of Mind — first-recall priority
- Consideration — shortlist inclusion
- Mention Rate — mention share
Cells are colored as a heatmap — higher scores appear more saturated. This lets you instantly spot strong and weak models.
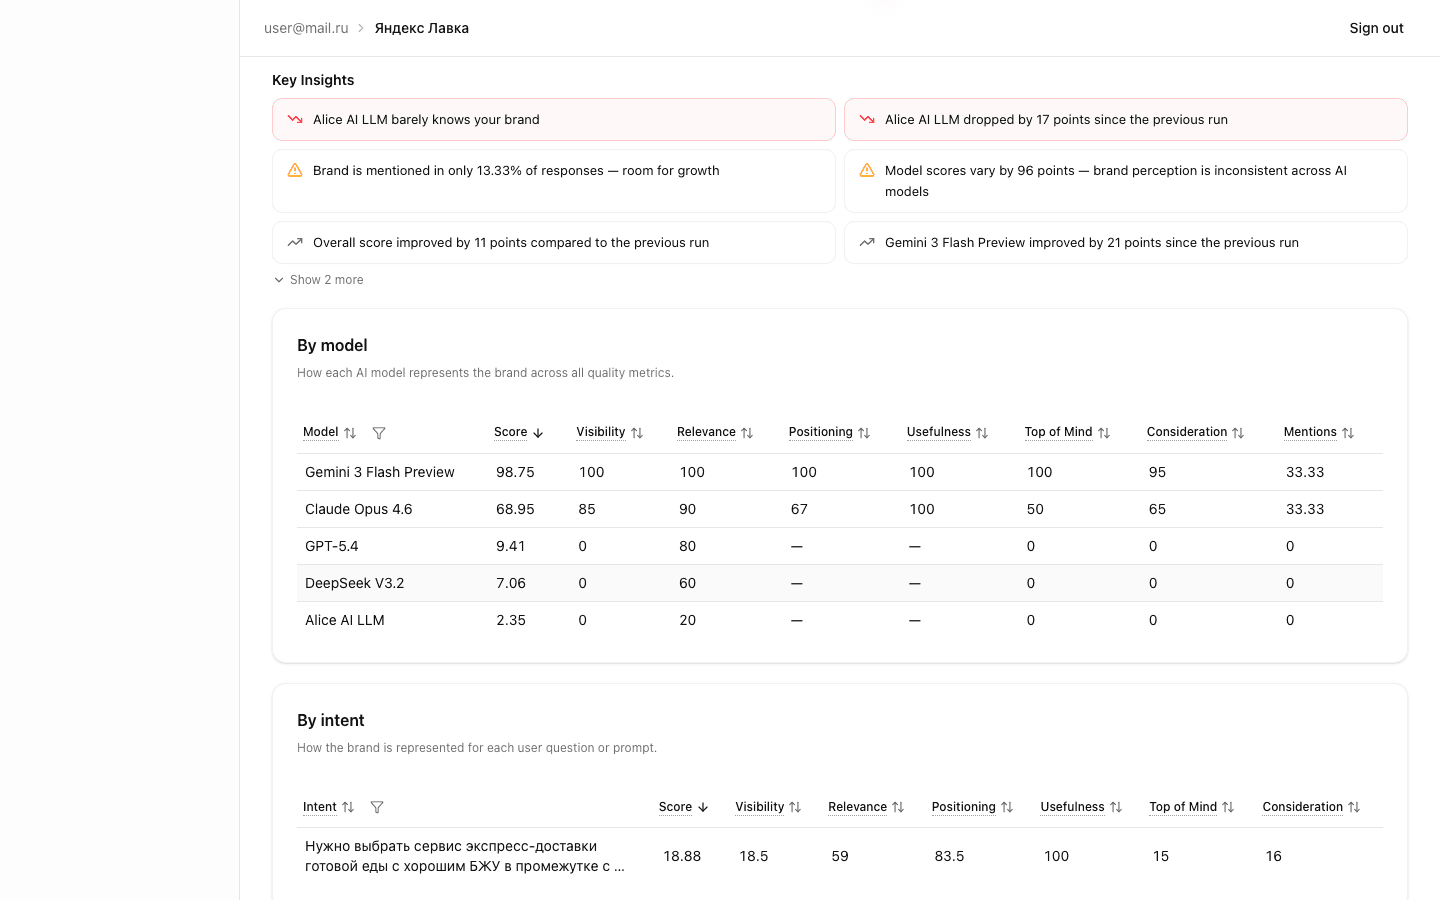
By Intent Table
Shows scores for each individual question (intent) in the scenario:
- Intent — question text (with tooltip for longer prompts)
- Overall Score — aggregate score for this intent
- Columns for each of the 6 metrics
Use this table to find specific questions where models perform poorly. Weak intents are candidates for rephrasing or signal a problematic brand area.
Key Insights
Automatically generated findings from the run data:
- Model comparison — which model scored best/worst
- Changes vs previous run — overall score increase or decrease
- Weak metrics — one of the 6 metrics significantly lagging behind
- Model spread — anomalously high score variance between models
- Low confidence — insufficient data for reliable conclusions
Insights are sorted by priority and help you quickly focus on what matters most.
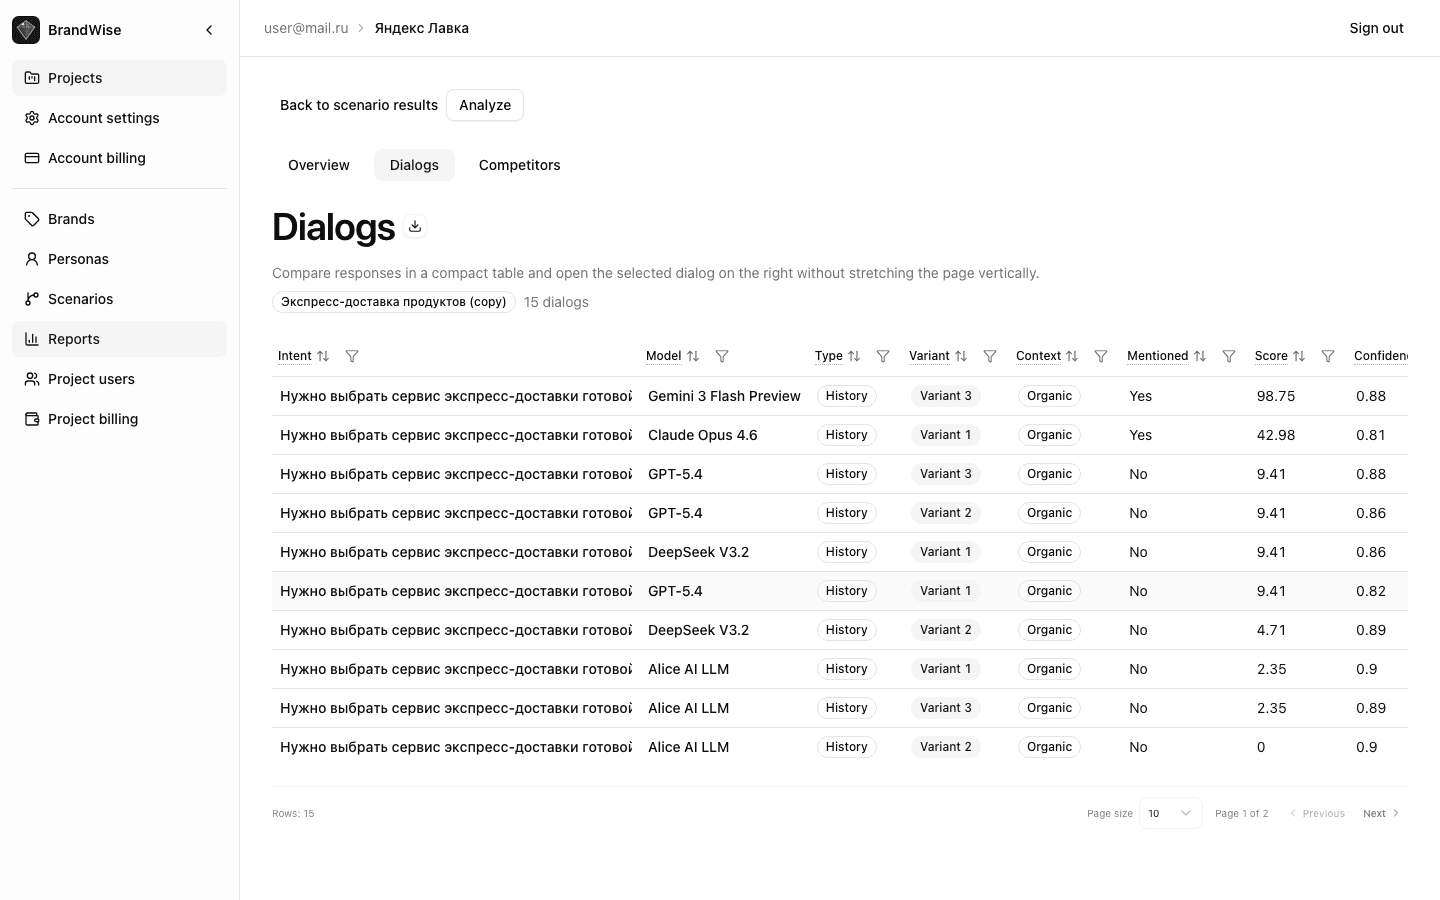
Dialogs Tab
The Dialogs tab provides the most granular level of the report. It displays every individual model response with the full data set.
Response Table
Table columns:
| Column | Description |
|---|---|
| Intent | Question text |
| Model | Which AI model responded |
| Type | Basic (single-turn) or History (multi-turn dialog with persona) |
| Variant | Response variant number (for multiple generations) |
| Context | Organic — brand not in prompt, Brand Prompted — brand mentioned, Unclear — indeterminate |
| Mentioned | Yes / No — whether the model mentions your brand |
| Score | Overall Item Score 0–100 |
| Confidence | Assessment confidence level 0–1 |
| Sentiment | Sentiment Score 0–100 |
Sorting: quick sort options — "Needs Attention" (weakest), "Weakest", "Strongest".
Filters: by model, by intent — focus on specific data slices.
Excel export: the export button downloads the complete table with all columns and dialog history as an .xlsx file.
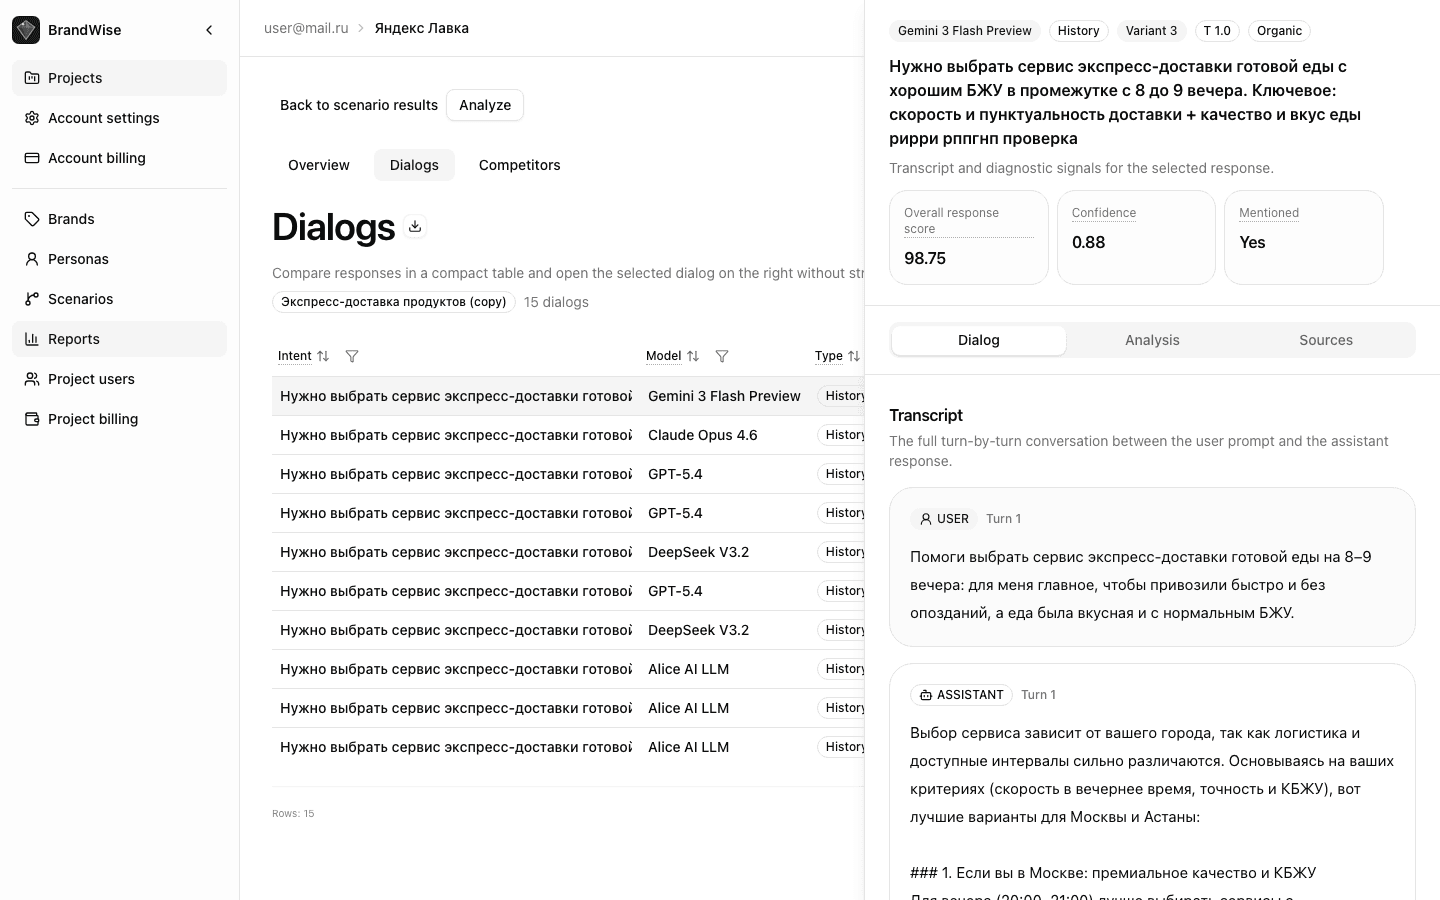
Dialog Detail Panel
Clicking a table row opens a side panel with three tabs:
Transcript Tab
The full USER / ASSISTANT conversation — a verbatim record of all dialog messages. For History mode, this is a multi-turn conversation; for Basic, a single question and answer.
The transcript lets you see the exact context in which the model mentioned (or didn't mention) your brand, assess tone, detail level, and mention position.
Analysis Tab
Component-by-component score breakdown for each of the 6 metrics:
- Scores for each metric component
- Evidence quotes — verbatim excerpts from the model's response that justify each score
- Final score calculation using the formula
Evidence quotes are a key BrandWise feature: every score is backed by a specific quote from the model's response, not a subjective interpretation. Learn more in the metrics reference.
Sources Tab
If the AI model used web search during response generation, this tab shows:
- Source URLs referenced by the model
- Quotes from web pages used in the response
This information helps you understand where the model gets its information about your brand and competitors.
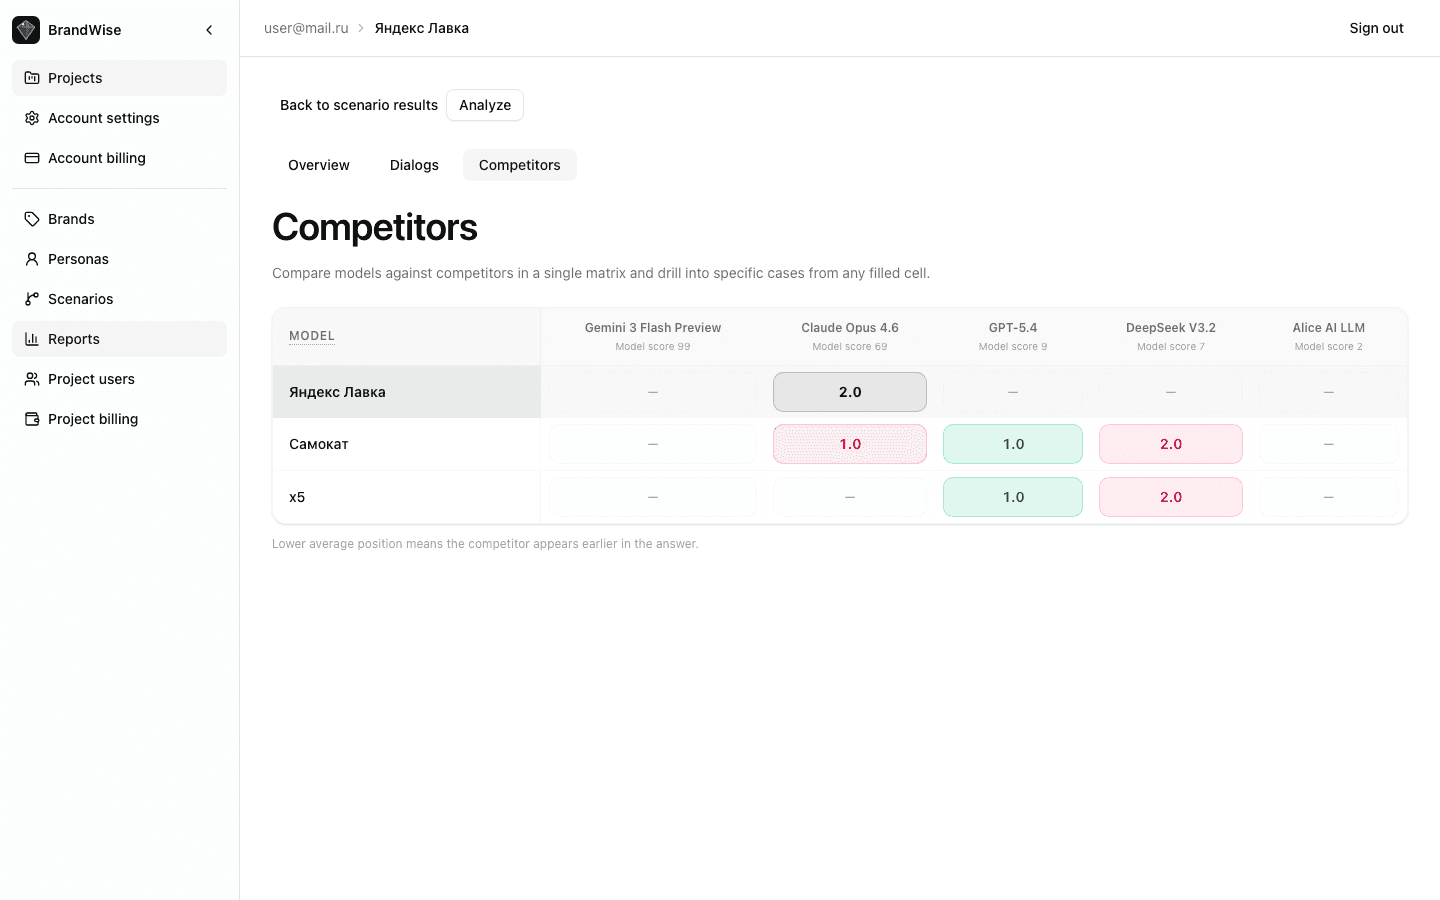
Competitors Tab
Competitor x Model Matrix
A color-coded matrix where rows are AI models and columns are competitors from your brand profile. Each cell contains the average position of the competitor's first mention.
Cell color intensity reflects positioning:
- Saturated color — competitor mentioned early (high position)
- Pale color — competitor mentioned late or rarely
Your brand is highlighted in the matrix for easy comparison.
Competitor / Model Pair Drill-Down
Clicking a matrix cell opens a drawer with detailed cases:
- List of all responses for the selected competitor + model pair
- Competitor position in each response
- Your brand's position in the same response
- Before/after flag — whether the competitor is mentioned before your brand
This level of detail reveals patterns: which models more frequently recommend specific competitors and in what contexts.
Working with the Run Report
- Start with Overview: assess Overall Score and KPI cards for the big picture
- Check Key Insights: automated findings highlight anomalies
- Study the heatmap: find models with anomalously low scores
- Switch to Dialogs: sort by "Needs Attention" and examine the weakest responses
- Read transcripts: understand exactly how the model describes your brand
- Analyze competitors: determine who is taking your positions
Next Steps
- Overview Dashboard — aggregated data across all runs for a period
- Custom Reports — custom query builder and 8 system presets
- BrandWise Metrics — formulas and components for each metric
- Create an account and get started
Overview Dashboard — Key Brand Visibility Metrics in AI
How to read the BrandWise dashboard: KPI cards, trend charts, scenario comparison table, Key Insights, and competitive analysis. Navigation, filters, and data interpretation.
Custom Reports in BrandWise — Builder, Presets, and Saved Views
How to create custom reports in BrandWise: 8 system presets, report builder with filters and grouping, Saved Views for teams. Step-by-step guide.